
Oil Analysis The Tests
Water Test
Water is one of those contaminants that will sneak into your system unnoticed, usually by way of condensation, entry when hosing down or internal coolers leaking.
It is one of the most common causes of failure as it causes the oil to degrade, build up acid or base and under load, turns to steam with an expansion factor of up to 2,000 times, which causes mini nuclear explosions on the loaded zone of the surface.
IT IS CAPABLE OF TEARING METAL OUT, DESTROYING SURFACE INTEGRITY AND EVENTUALLY LEADING TO COMPOMENT FAILURE.
If your oil analysis indicates that your system has water contamination, do not under estimate the damage it can cause. Change the oil, identify and rectify the source of the contamination. In engines, water is more damaging as the sulphurs combine with water and oxygen to cause the formation of acids, which literally eat away at the bearings. Engine oils usually operate at high temperatures which will evaporate any condensation entering, hence any water in engine oil at any level usually indicates internal leaking.
NEVER IGNORE A POSITIVE WATER TEST, IT WILL EVENTUALLY LEAD TO COSTLY REPAIRS.
Diesel Dilution Test
Diesel dilution is also a common cause of engine failure as its effect on oil is that it causes viscosity to drop dramatically, the more diesel, the lower the viscosity.
The lower the viscosity, the weaker the film strength. Diesel readings of around 0.5% can often be reduced by controlling excessive idling times, however any reading over 1% should be acted on as this will cause a significant viscosity drop by around 20% or more.
The higher the diesel dilution, the lower the flash point which means that a crank case can ignite if the sump temperature reaches say 130degC with 6% diesel dilution, which is the temperature at which that concentration of fuel vaporises and becomes explosive.
On the other hand, care needs to be taken when interpreting diesel levels, as often the diesel in certain forms of unburned fuel will cause excessive sludging in the oil. This can cause the viscosity to increase and the oil can thicken to the point where it becomes un-pumpable in the engine, causing catastrophic failure due to oil starvation. New engines have been known to fail through this cause of inefficient combustion by over fuelling, which can also be indicated by excessive exhaust emissions.
Always check a positive diesel reading as the black smoke and high soot levels not only mean increased and excessive wear to an engine, but they also equate to money burning out the exhaust pipe. Soot particles are 4 times more abrasive than dust particles and are a major contributor to wear. They get larger as combustion efficiency decreases.
Never wash or flush equipment with diesel as any residue remaining will dilute the new oil reducing it’s viscosity and destroying the oil’s integrity.
Total Base Number (TBN)
The sulphur residues which are a by product of the combustion process enter the oil by way of blow-by.
They then combine with oxygen from the air and moisture, to produce acids which if left unchecked will etch metal components in the engine.
Consequently, when we buy new engine oil, it has a ‘base reserve’ built in to the additive package, which is designed to neutralise the acids as they are produced. As with all acid base reactions, the ‘base reserve’ is used up in the process of neutralising these acids.
This Base reserve is called the TOTAL BASE NUMBER which is a measure of the level of BASE in the oil and is determined by measuring the amount of Potassium Hydroxide in mg taken to neutralise the base reserve in 1 gram of oil (mgKOH/gm).
In the average engine oil, the starting TBN is usually around 6 to 9, however if we are looking to extended drain interval oils, we need to increase the initial TBN so we don’t allow the reserve to be depleted before the oil is drained. In some oils, a starting TBN 15 is not un-common and a depletion level should never get below TBN 3, which is a signal to change the oil.
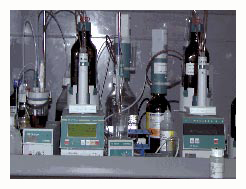
TBN is also a useful tool in assessing an engines combustion efficiency, if rapid depletion is observed. If an engine’s combustion is inefficient, unburned diesel will enter the oil as blow-by, forming acids and using up TBN reserves. Exhaust emissions will often be visible as excessive smoke which in extreme cases will form ‘wet’ soot with large soot particles on the exhaust which will have a detrimental effect on engine wear.
Have your TBN checked periodically in your engine to monitor combustion efficiency.
Remember when practicing extended drain intervals in engines, always have your TBN checked, which with viscosity is used as a drain indicator.
Total Acid Number (TAN)
In non-combustion situations, we don’t have the by products of combustion to cause acids to form; however to a lesser extent, we experience acid generation as the additive package of the oil is depleted due to use and the effect of moisture.
In gear and hydraulic systems, the Sulphurs and Chlorines in the oil will become available to combine with water and oxygen which can lead to the formation of Hydrochloric and Sulphuric acids.
These acids although usually at low levels can destroy metal surfaces if left unchecked, hence we need to monitor the acid levels, particularly in long drain interval situations such as Turbines, Hydraulic systems and gearboxes.
Any rapid rise in TAN should never be left unchecked. A TAN of 0.5 mgKOH/g should be watched, however this level will depend on the system application and limits set by OEMs which should always be known to the operator before any assessment is acted on.
Watch for sudden movements in TAN levels in non-combustion compartments and take action if it moves suddenly.
Microscopic Analysis
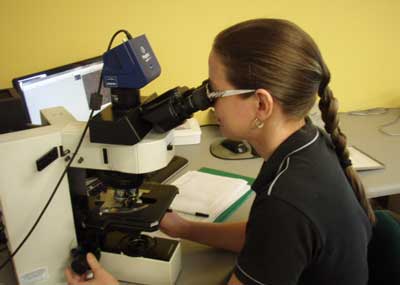
Microscopic Analysis opens a complete new world in used oil condition monitoring. It allows us to look inside the equipment and see what is going on.
From the microscope, we are able to get a full picture of –
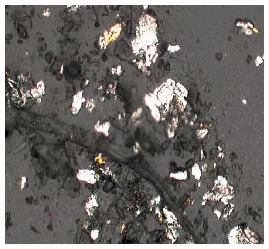
- The type of contamination which is effecting your machine’s health
- The concentration of wear particles within the machine
- The type of wear which is being generated
- How the condition of the oil is being maintained
- Is the correct oil being used for the application
- he condition of the oil in use
- Collect a visual image to store results for later comparison purposes.
We are no longer relying on machines to select and tell us only what ‘they want’, as is the case with the commonly used spectrometer.
Microscopic analysis is generally accepted as the most effective method of wear debris analysis as it allows us to see what type of particles are being generated in the oil, accurately count the particle numbers, size group them and examine their morphology from which we can assess the oil’s performance.
Our experienced operators can tell from what they see, what needs to be done to improve the operating conditions within the machine.
The down side with an optical microscope, is that we do not have any way, other than colour, to try to determine the composition of the particles without going to an expensive Scanning Electron Microscope. Hence, in conjunction with the optical microscope, we use an ICP Spectrometer to help with identifying particle compositions. (See next section).
Our microscopic examination involves counting the particles, then size grouping them into 3 classes: – 0 to 10um, 10 to 20um and greater than 20um. Particle count and size grouping provides the basis for our wear trending.
We then determine the type of particle and sort them into their categories; it tells us a lot about your oil performance.
Rubbing Wear which is a normal wear type, caused by the asperities being torn off the surface under load. They are a normal wear particle unless they are visible in very high numbers where they indicate potential failure.
Cutting Wear is generated when two surfaces come into contact (a barrier condition) and one surface gouges the other, giving rise to a gouged cutting particle. Alternatively a foreign body between the two surfaces can gouge giving rise to a three bodied cutting particle. Cutting particles are easily identifiable by their shape like a scoop of ice cream, lathe swarf or needle like slithers. They can indicate oil viscosity is too low for the operating conditions hence we need to look at oil type in use.
Laminar Wear. A large surfaced but very thin particle, which has literally laminated from the component surface, and usually indicates surface on rolling elements is failing.
Fatigue Wear is caused by the continual flexing of the load zone which eventually, due to fatigue cracking, causes a particle to be generated. The result is seen as common pitting of the surface.
Spheres are caused when two components enter into a barrier condition and when molten metal is generated under very severe load conditions and as the metal is carried off in the oil, the metal solidifies on cooling resulting in the formation of a sphere due to the equal pressures. They are a very bad sign in any oil sample and usually indicate oil film failure. In some cases, they can also indicate the presence of electric currents such as eddy currents and are very common in large motor bearings or hotter tropical environments.
Dark Oxides are commonly known as sludging and when at high levels, mean the oil is spent. They are helpful in determining the useful life of the oil. High numbers of dark oxides will usually cause an increase in viscosity and means the dispersant additive in the oil is spent. They are also a good indicator of severe operating conditions in an engine.
Particle Contamination. A good indicator of the dust ingression and the operational cleanliness of the compartment. Site dust contamination in coal or copper mines are readily visible as dirt particles.
Soot particle concentration and size are monitored visually. Soot particle size allows us to monitor the condition of the combustion chamber – if they start to increase, expect to see an increase in wear as soot has similar abrasive properties as does dust.
The microscope also allows us to visually assess the condition of the oil and whether it is in a suitable condition to continue operating, be cleaned or discarded.
IF WE REDUCE CONTAMINATION AND WEAR, THE AVAILABILITY, THE LIFE OF THE MACHINE AND OIL LIFE WILL ALL BE EXTENDED
Spectrographic Analysis
The spectrometer operates with a very intense plasma arc which burns the sample at approximately 13 000 deg C. The light emissions from each element are then measured in intensity and their concentrations calculated in parts per million (PPM) of the element monitored.
The Spectro analysis results give us an indication of the elemental composition of the wear metals present in a sample. However the Spectrometer is limited, due to its ability to read only particles smaller than 5um; Hence it is not a good failure forecasting tool because of its inability to accurately measure true element levels represented by the larger particles.
In the early stages of failure, larger particles will be generated which pass through undetected by the spectrometer. These particles will not be read until they have been in the system for long enough to be ground into fine particles bypassing through the bearings, gears and other components of the system, often destroying perfectly good equipment as they operate. Hence an entire system is now damaged in all component areas by the time the spectrometer picks it up.
Coupled with the microscopic analysis, which looks at all particle size and shapes, but cannot identify elements, and with the spectrometer identifying the elements but ignorant of size, we are able to monitor wear trends and forecast potential failures early with a very high degree of accuracy. Providing regular samples are taken from the trend, we can identify a potential failure before it becomes a major catastrophe causing severe damage and unplanned shutdowns.
In cases when it may be necessary to identify the predominant wear elements in large particles, we are able to digest the particles in a strong acid solution. This method is called Acid Digestion and is the method by which the spectro analysis results become very accurate. However, it is not a preferred practice due to the slow preparation time and consequently high labour cost per sample resulting in higher sample charges.
Acid digestion is however, a very effective means of measuring and monitoring wear levels in grease samples. The entire contents of the grease sample are digested into solution and all elements fully measured.
The spectrometer also allows us to accurately monitor contamination levels such as dust through Silicon and coolant through Sodium or in marine applications saltwater ingression.
We also look at oil additive levels with the spectrometer, which allows us to trend additive levels, or if the compartment has been topped up with the wrong oil as different types of oil have different element levels in their additives.
Remember regular scheduled sampling allows early failure detection and facilitates shutdown planning which equates to continued production which equal profits.
Results from the Spectrometer
One of the most commonly asked questions regarding wear metal analysis is: “What do the spectrographic analysis numbers mean”?
This is a course subject on its own and will vary in every different type of unit. Mostly the concentrations of the elements are expressed in Parts Per Million (PPM) or occasionally as percentages. These elements will give us a guide to the origin of the wear metals. Very briefly, they go roughly like this:
Wear Metals
- Iron. Cylinders, crank, gears, roller bearings, camshafts, gears, rings and valves.
- Lead. Bearings (white metal), additives, bushing or petrol.
- Tin. Bearings (white metal), bushing and piston skirts.
- Copper. Bearings, bushes, thrusts washers, gears, brasses, bronzes and additives.
- Aluminium. Pistons, washers, housings, bushing and clay dust.
- Chromium. Hardening material from cams, rings, rollers, valves and shafts.
- Nickel. Hardened or stainless steel shafts, valves and roller bearings.
- Vanadium. Used with chrome coating and on valve stems etc.
- Titanium. Aircraft components and lightweight, high strength parts.
- Silver. Bearings, ring coating in some early engines and solder.
Contaminants
- Silicon. Dust, sealant and gasket material, coolant and anti-foam additive.
- Sodium. Coolant additive, salt water contaminant or detergent additive.
Additives
Additives are added to base oil to enhance the properties of the oil for different uses, hence are a helpful identifier to check for cross contamination and in some cases contamination levels.
- Calcium. Usually high in engine oils as TBN, detergent or dispersant additives.
- Magnesium. Detergent, dispersant additives (higher in engines).
- Boron. EP and coolant additive.
- Manganese. Detergent additive and lightweight metal.
- Phosphorous. Anti-wear additive.
- Molybdenum. Anti-wear additive with extremely low co-efficient of friction.
- Zinc. Anti-wear, EP and anti-rust additive.
- Sulphur. Naturally occurring in base oil, anti-wear additive, extreme pressure additive and combustion by-product.
Remember when interpreting spectrographic results, it is important to monitor the trend of the elements rather than the actual elemental levels. Check and stay below the manufacturer’s recommended limit but be alerted of a pending problem whenever wear trends move by more than 10% over similar oil hours…. always sample on a consistent and regular basis to maintain accurate trends – the key to a successful program.
Viscosity
The single most important property of oil.
Viscosity is a measure of a fluid’s resistance to flow to which many of the qualities of oil are directly related. It is a very good indicator as to whether or not oil’s life has been depleted; hence one of the key characters in deciding when to drain oil.
Film strength is directly related to viscosity and is a major value in hydrodynamic lubrication.
For monitoring purposes, viscosity is normally measured at 40 degC (100 degF) with the Australian accepted unit of the Centistoke (cSt), however some imported oils use different units, such as the US Centipoise (cP) or Saybolt seconds (SUS) which is the preferred US unit.
Sometimes we also measure viscosity at 100 degC (212 degF) which in many cases is closer to the operating temperature of the oil and can be a more useful value in higher operating temperature machinery such as engines.
The difference in viscosity between 40 degC and 100 degC is also used to calculate the ‘Viscosity Index’ (VI) of the oil which is a single unit measure of the change in viscosity relative to temperature change. The higher the V1 number, the less the viscosity variation between the two temperatures. A high V1 oil will have a typical value of around 140 and low values can approach 0.
Viscosity ‘shear’ with use as the oil condition deteriorates leading to a drop in viscosity. In some engines, this condition will be evident as an increase in oil consumption which means the oil condition is deteriorating with use. Shearing is less common with today’s high quality oil technology than it has been in the past, however using multi-grade engine oils (15w40) in some high performance hydraulic systems will lead to immediate shearing.
Our main interest with viscosity in used oil analysis is the movement in viscosity of the sample oil from new. As a general rule, a movement of plus or minus 10% up to 20% of original viscosity (depending on operation standards set) is a good indicator when oil change is due.
If viscosity increases the cause will be either particle contamination or oxidation (burning).
If viscosity drops, the cause will be either fluid dilution or shearing. Always check viscosity when monitoring oil condition.
Never ignore viscosity movements, there is always a reason. Identify and act on the cause to preserve your oil’s integrity which will keep your wear levels reduced.
ORDER YOUR OIL SAMPLING KIT TODAY